The Gun Violence Archive is an independent organization that gathers information about gun violence via the news, social media, and police reports — and amasses it into a publicly available database.
There are limitations to this approach: Not all acts of gun violence are covered in the news or posted on social media, and not every police department publicizes their incident logs, so the data is inherently incomplete. This incompleteness can be unpredictable, and thus difficult to statistically take into account.
It is possible that some places that appear worse in GVA data are actually places where a higher proportion of cases are captured, and some year-over-year change may actually reflect improvements in data collection. However, the fact that there are decreases as well as increases challenges this theory.
On the other hand, there is no other national database that tracks shootings in near-real time.
Data from the Centers for Disease Control and Prevention is not complete until more than a year after a calendar year has ended. CDC also includes only deaths, whereas the GVA also tracks injuries.
The GVA also attaches latitudes and longitudes to incidents, which allows us to ask specific questions about where shootings take place.
It is our assessment, as well as that of academics, that the timeliness and completeness of GVA data outweighs its limitations.
Attaching shootings to places
We used a technique called a spatial join to attach the latitude/longitude combinations of the shootings to census tracts. This lets us bolster the GVA data with information about populations, cities, and the level of urbanization in a shooting’s location.
Because census tracts are redrawn after each decennial census, we matched pre-2020 shootings to pre-2020 census tract shapes, and post-2020 shootings to post-2020 census tract boundaries.
Less than 1 percent of rows in the data either lacked latitude or longitude, had coordinates for a location outside the United States, or otherwise failed to join with a census tract and were not included.
Estimating population
Where we needed population estimates in our analysis, we summed census tract level population values from the five-year American Community Survey contemporaneous with the year of a given shooting.
However, 2023 estimates are not expected until December of this year. For 2023 values, we used the 2022 population of each census tract.
Investigating America’s gun violence crisis
Reader donations help power our non-profit reporting.
What kind of place
We wanted to characterize the places affected by shootings in ways that readers could relate to. We decided to use a classification system produced by the National Center for Health Statistics and used by the CDC.
However, because the NCHS system uses categories that we feel are not useful for most readers, we attached our own terminology:
1 – Large city – 1 million or more inhabitants
2 – Suburbs – Areas adjacent to cities with 1 million or more inhabitants
3 – Small city – 250,000 to 999,999 people
4 – Large town – 50,000 to 250,000 people
5 – Small town – 10,000 to 49,999 people
6 – Rural area – No towns of 10,000 or more people
These classifications probably undercount shootings we’ve characterized as outside of cities in our reporting. This is because there could be small communities and rural areas in a county that also contains a large city. Under this classification, shootings in those places would be considered “urban,” though the people living there probably wouldn’t describe the place that way.
Our analysis of city vs. non-city shootings defined non-city as a place given a classification of 2 through 6.
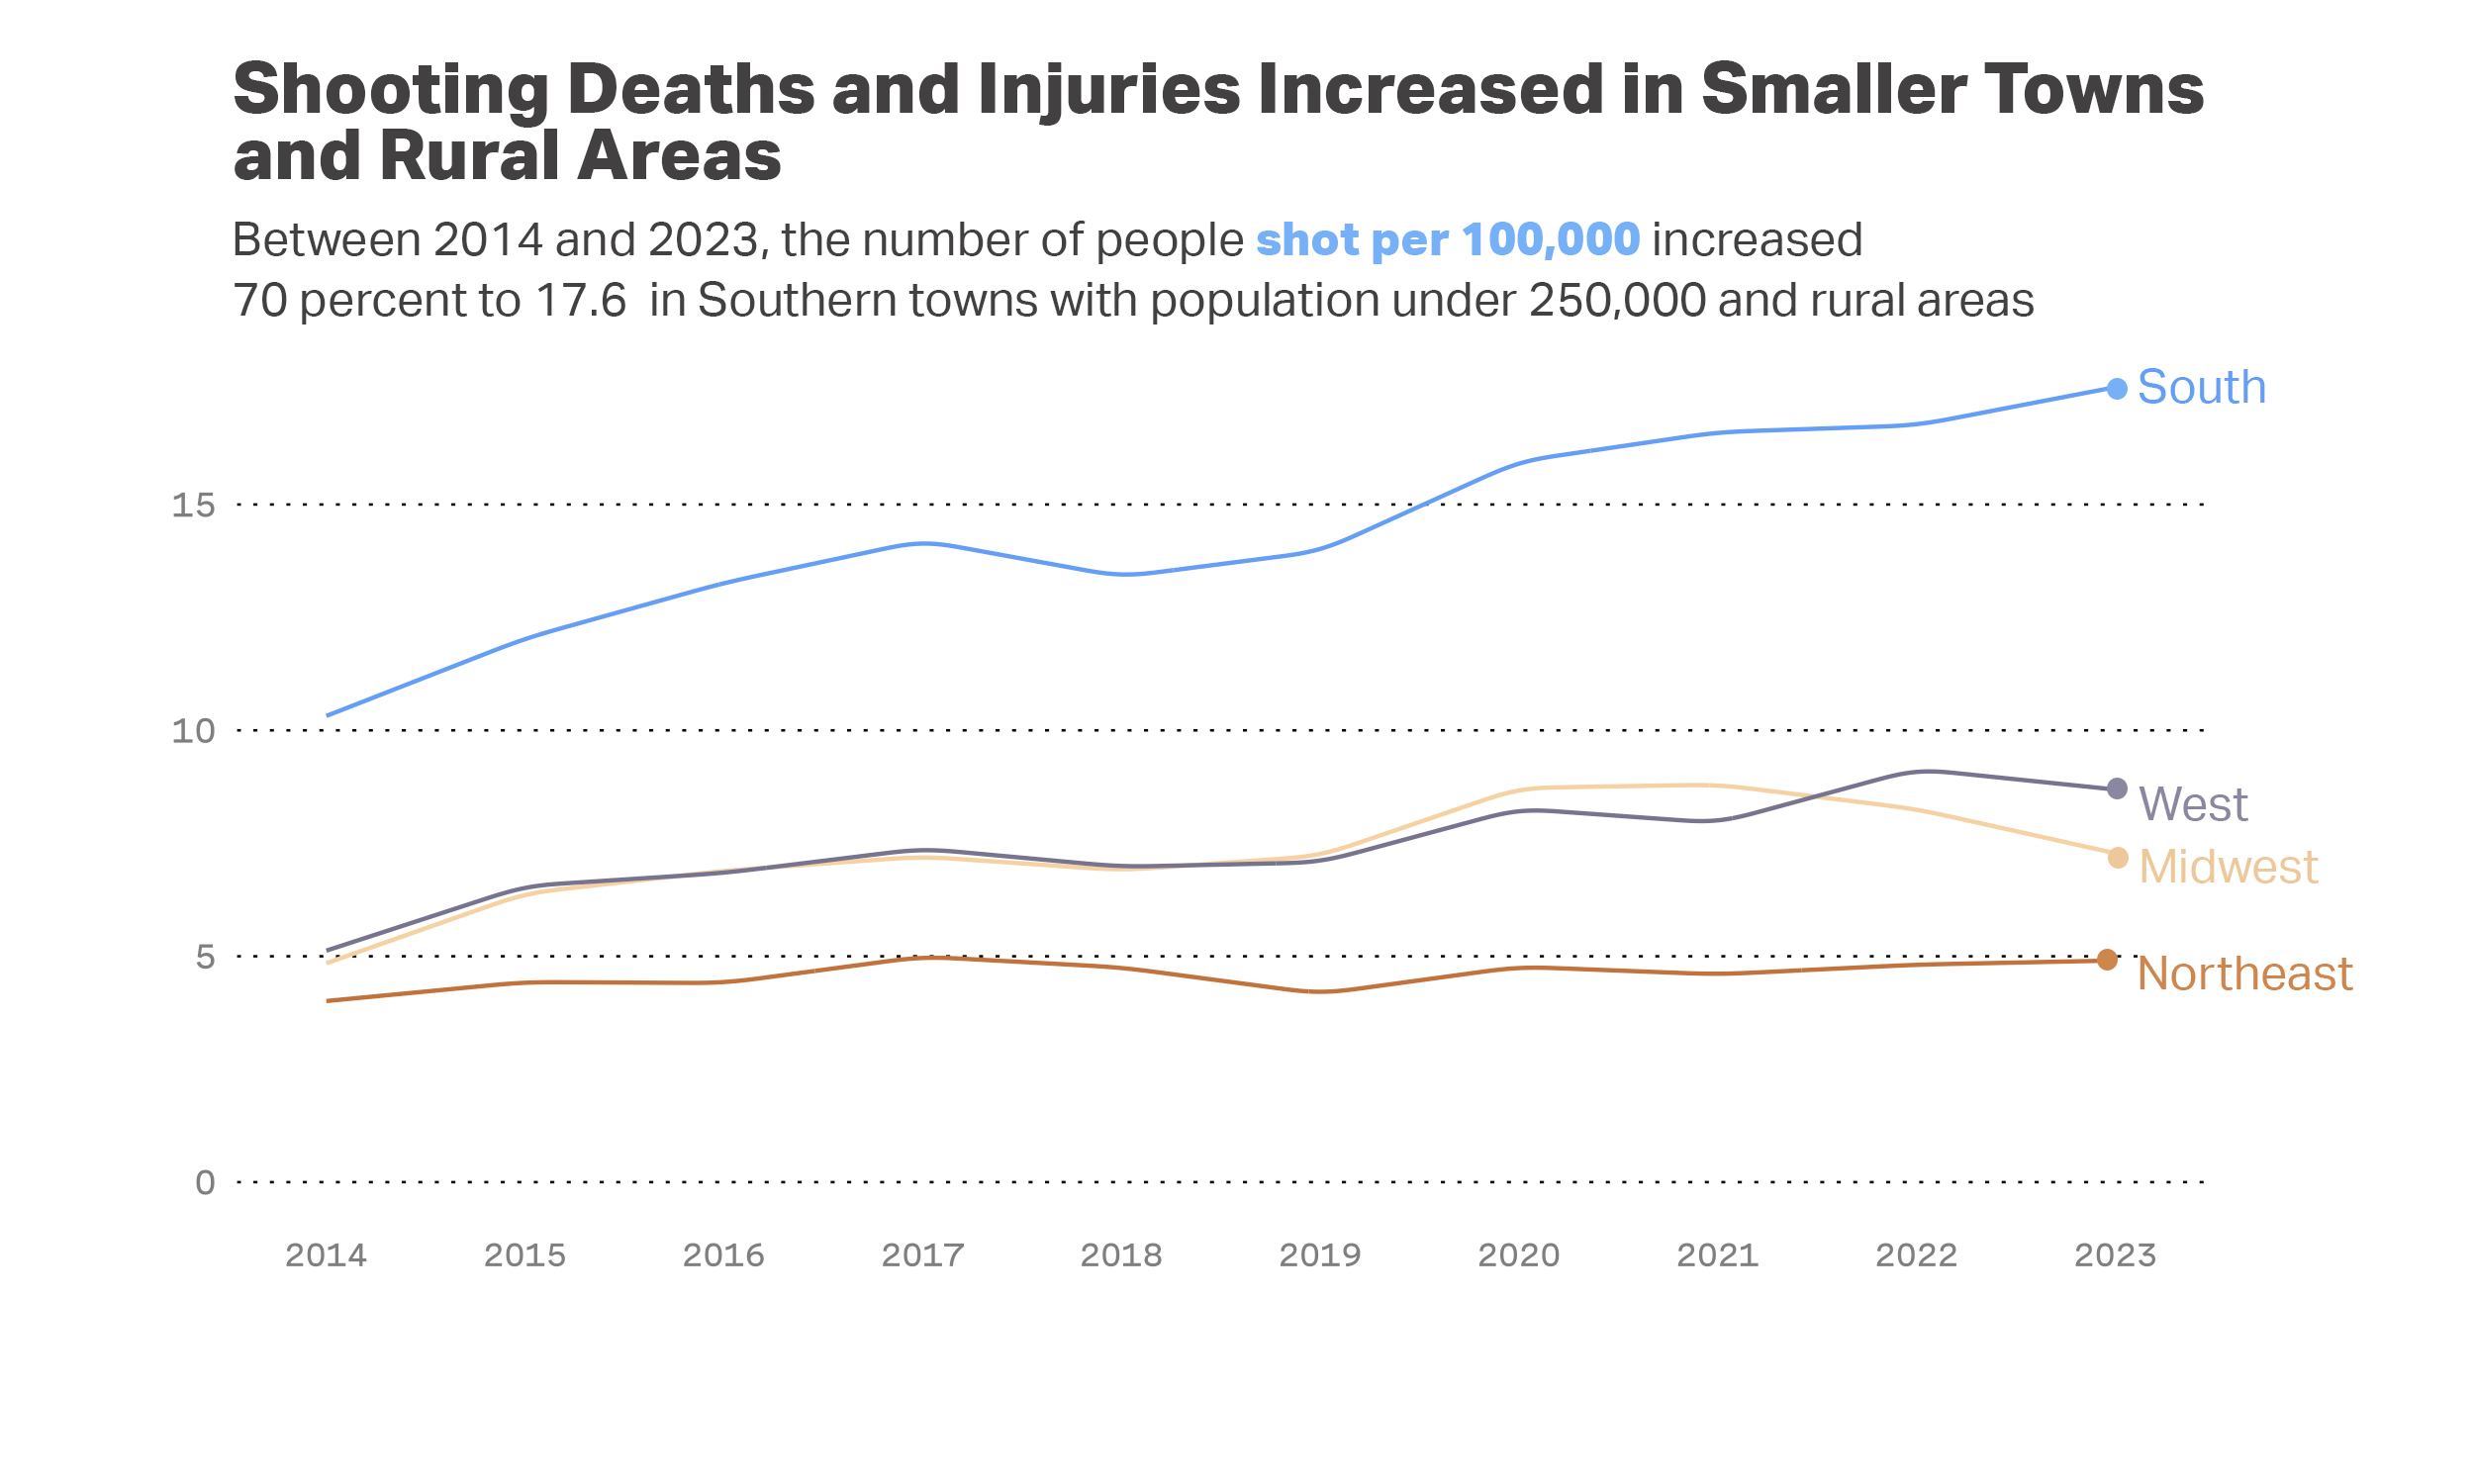
The second chart in our story has grouped all shootings that were given a classification of 4 through 6.
The third chart in our story looked at cities with a classification of 3.
Ranking metro areas
Administrative boundaries of places largely do not reflect actual residential patterns. Kansas City, Kansas, and Kansas City, Missouri, for example, are one contiguous community. To take this into account, the Census Bureau has designated units called core-based statistical areas. One example is Boston-Cambridge-Newton, in Massachusetts.
When we ranked metro areas for our analysis, we first ranked complete CBSA’s.
However, we found that this was diluting the rate of shootings in some large cities, especially those — like Washington, D.C. — that have a city core and suburbs surrounding.
So, to be conservative, we split the cores of CBSA’s — the areas classified as 1 — from their surrounding areas classified as 2 or above. This moved some large cities, such as Baltimore, up our rankings. It also yielded some interesting cases where outlying communities around a core are more dangerous than the core itself.
So, when we say Baltimore in our story, what we are referring to is the core areas of the Baltimore CBSA.
Here is a link to a handy map of all CBSAs.
What is the likelihood of being shot?
There are multiple options for measuring the frequency of gun violence using GVA data. Deaths per 100,000 residents is probably the most reliable measure, but we know that it leaves out two-thirds of those who are shot or injured. Therefore, using the number of incidents per capita is a more stable estimate – the count in a community can’t be swung by a single, high-casualty incident.
What we assessed is the likelihood of being shot in a place, or the number of people struck by bullets divided by the total population, which is a measurement of killings plus injuries per 100,000 population. In our story we describe this combined metric as shootings. When we say, “You’re more likely to be shot in Selma than Chicago,” we mean that you are more likely to be killed or injured by a gunshot.
Are suicide deaths included?
The GVA does not include suicide deaths unless they are associated with a crime or a murder-suicide. The CDC reports on individual suicides; however, because of privacy policies, these numbers are only available in aggregate and don’t include any details like granularity and geolocation.