With businesses shuttered, social gatherings forbidden, and city streets largely empty, sheltering-in-place has produced one welcome side effect: Most types of crime, from drug offenses to robberies, have dropped considerably.
But data analyzed by The Trace reveals that there is a major exception: gun violence. In Dallas, for example, the city’s stay-at-home order has done nothing to slow shootings. Between March 24, when the order took effect, and April 22, overall violent crime was 19 percent lower than average. But the city recorded 63 shooting incidents — 50 percent more than the average for this time of year. In one, a man was found dead of multiple bullet wounds early on a weekday afternoon outside a popular public recreation center shuttered to stop the virus’s spread.
An analysis of data collected by Gun Violence Archive, a nonprofit that tracks shootings in close to real time, shows more than 2,000 gun deaths in the United States between March 1 and April 19 — a 6 percent increase over the same period in the past three years.

To understand how stay-at-home orders are influencing gun violence at the local level, The Trace reviewed crime data published by police departments in the 50 largest cities in the United States. Nine offered reliable, up-to-date records that track shootings or the weapons used in crimes.
These charts compare levels of gun violence — shootings in some cities, firearm homicides, and assaults in others — and other violent crime that did not involve guns in the periods before and after each city fell under a stay-at-home order, relative to those same times over the past few years. (Shootings tend to increase as weather warms, so comparing each period to the average levels at that time of year is more useful than directly comparing the periods before and after lockdown.) Neither the law enforcement data nor the Gun Violence Archive figures include gun suicides, which make up the majority of annual gun deaths.
Cities like Detroit, Newark, and Louisville don’t make up-to-date crime and weapon data available, but news outlets have reported increasing gun violence in those places, as well.
Driving the city trend lines are hundreds of homicides and assaults. Philadelphia has been grappling with an outbreak of shootings since the start of the year. In late March, the week after its stay-at-home order took effect, the city recorded 40 shooting incidents — nearly double what it typically sees that week. A barrage of gunfire at a birthday party left five people injured, including a toddler.
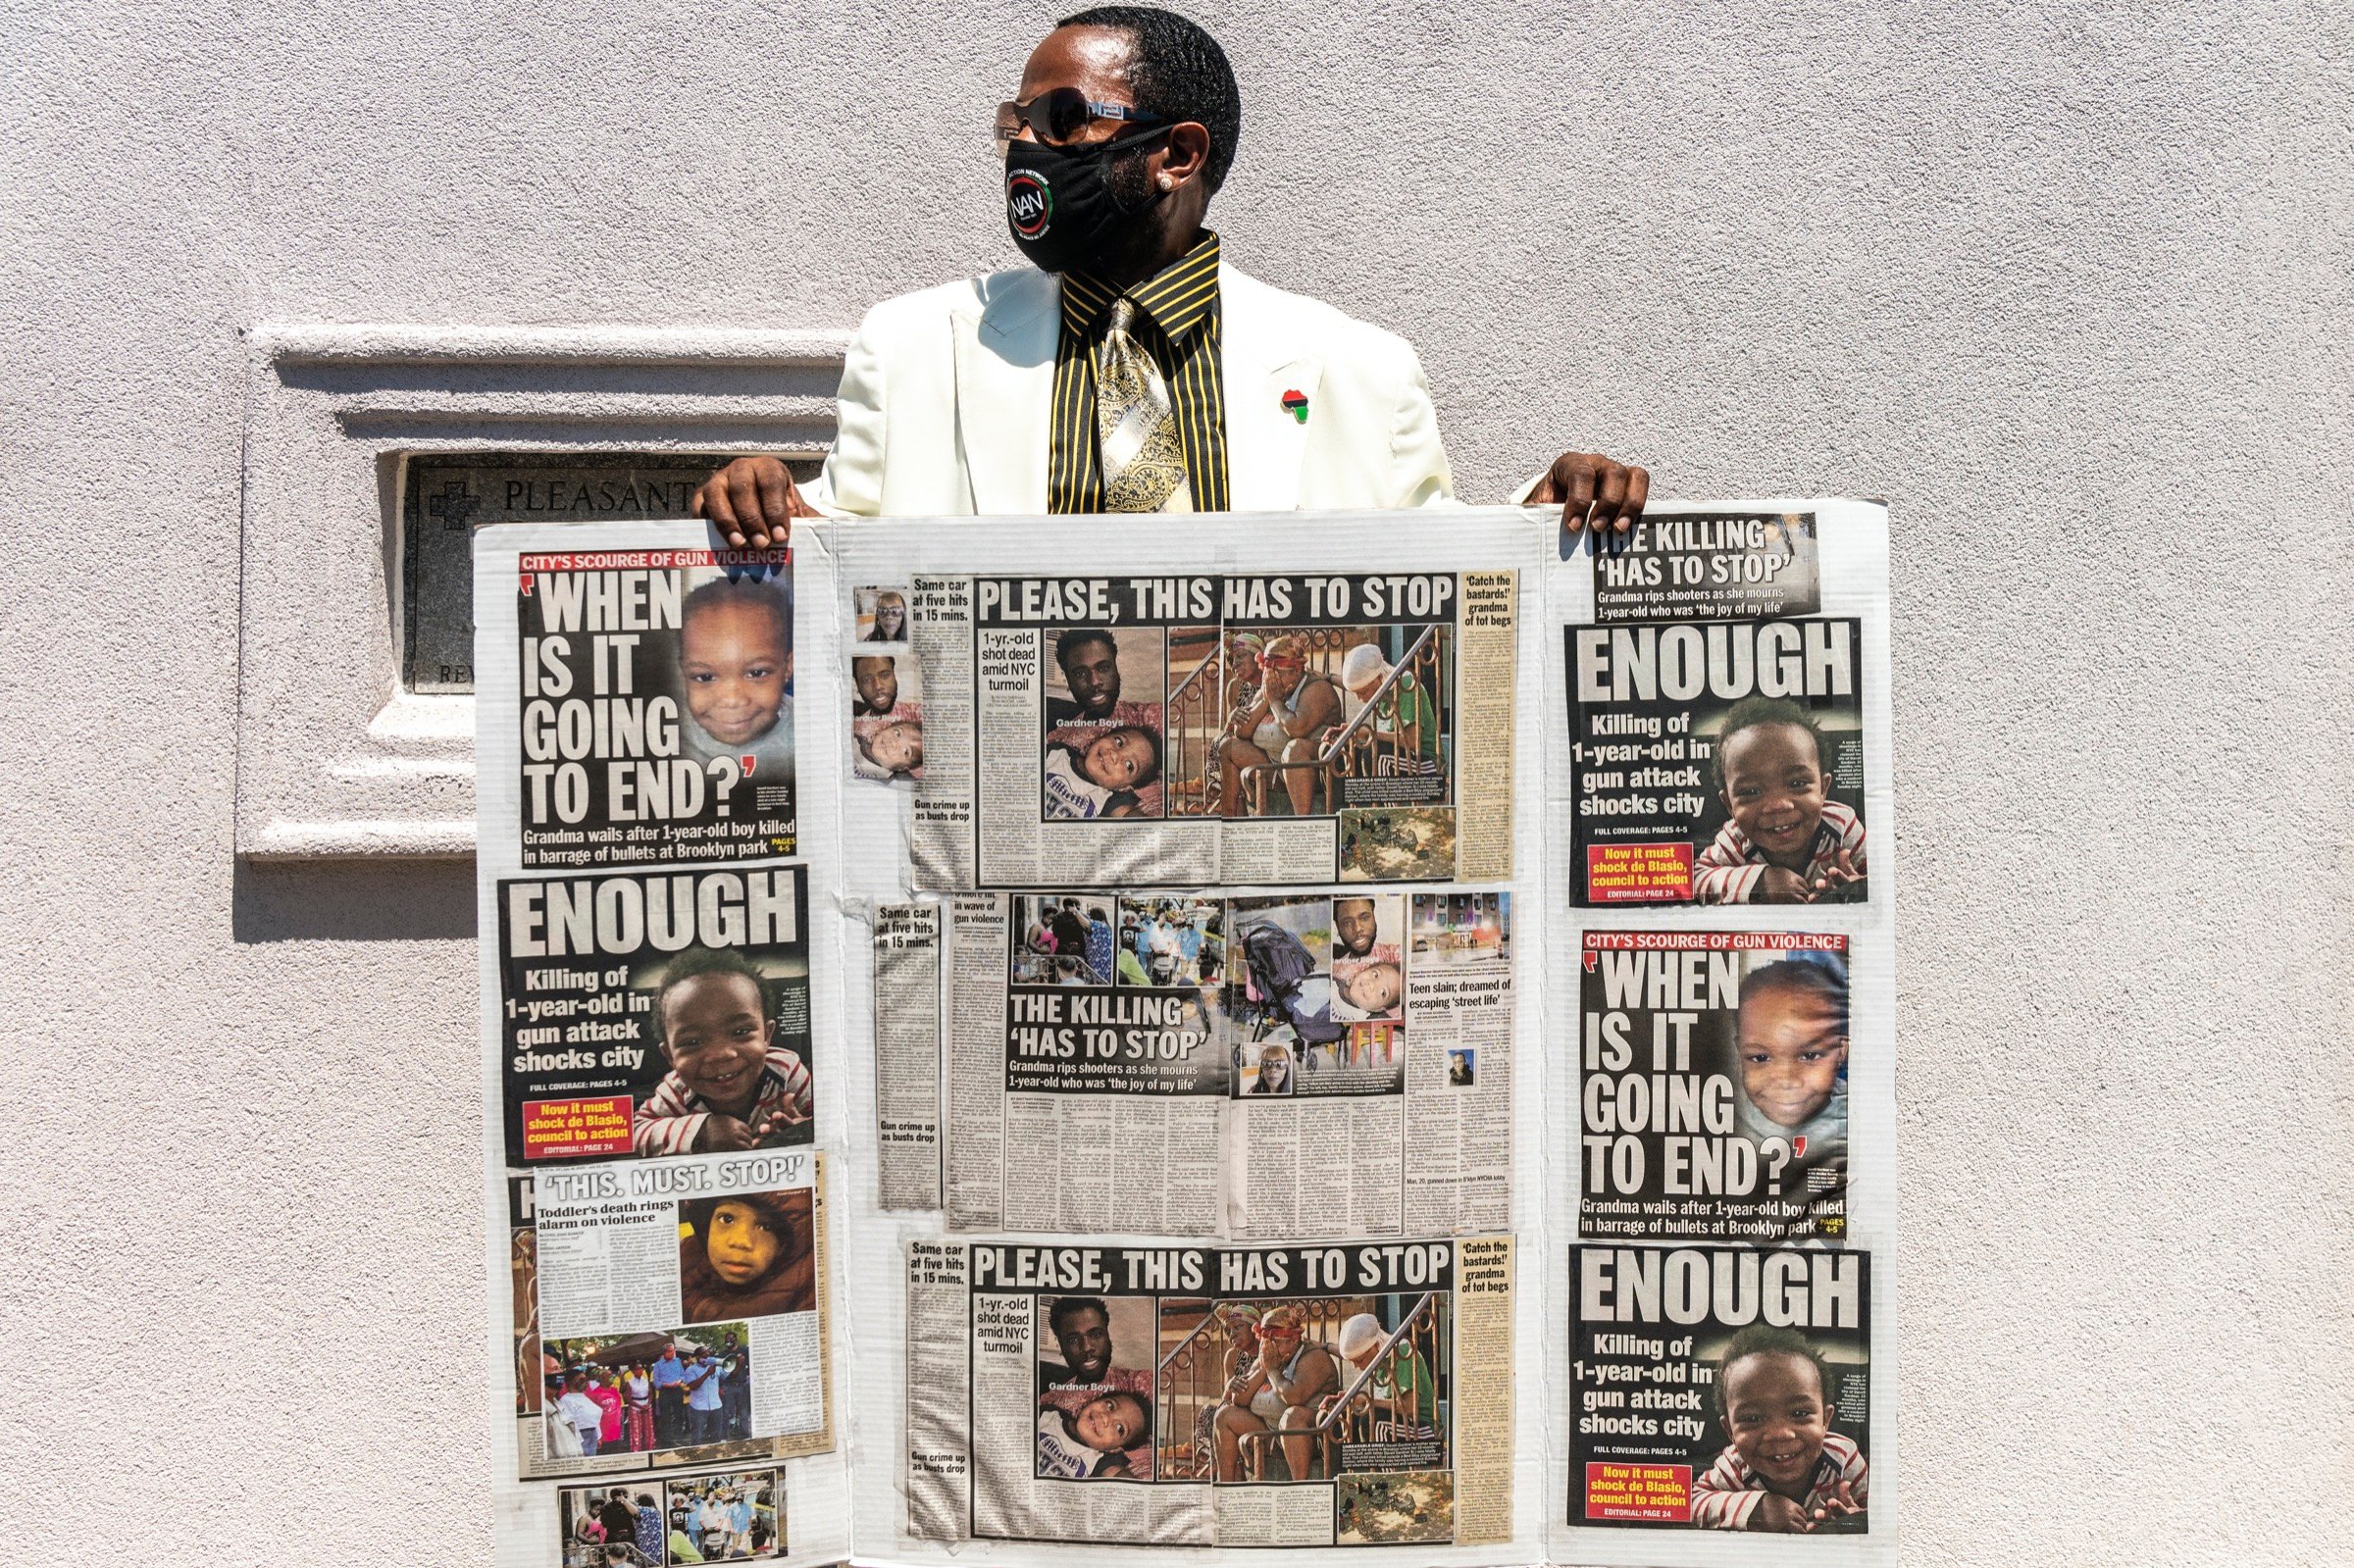
Shootings also tend to cluster in some of the same underserved, predominantly black neighborhoods that have been hardest hit by COVID-19 infections. Frontline violence prevention workers are facing dire conditions as they battle the twin crises.
In Chicago, New Orleans, and Washington D.C., gun violence fell during the lockdown period compared to the preceding weeks, but not as much as other non-gun crime. Each of those cities had seen elevated gun violence before stay-at-home orders took effect, so now it’s hovering around the levels typically seen at this time of year. New Orleans recorded 64 shootings since Louisiana’s order took effect on March 23, which is slightly higher than the 58 it recorded on average during the same time period in 2015-2019. Other violent crime was 20 percent lower than usual.
Baltimore and Los Angeles have fared the best, with post-lockdown gun violence falling to rates significantly below average. Los Angeles has seen 227 incidents of gun violence since California’s order was issued on March 19, well below the 282 it typically records this time of year. But even in these cities, other crime fell to lower levels than gun violence.
Drawing broad conclusions from short timeframes and small quantities of data can be risky, and it will likely be months or years before we fully understand how the coronavirus has affected violent crime trends in America. But the unique characteristics of urban gun violence may help explain why shootings have continued in cities under lockdown as other crime fell away.

“With more people hanging around and available to each other, I would expect shootings to stay the same or go up,” said John Roman, an economist who studies crime patterns at the University of Chicago. “People are not in school, not at work and not in training and other things that take them away from their neighborhoods.”
The absence of bystanders — and police — who would ordinarily inhibit some acts of crime may also create space for gun violence to flare up.
“With more people indoors, it is probably less risky to commit premeditated acts of gun violence because there are fewer witnesses,” said Daniel Webster, director of the Johns Hopkins Center for Gun Policy and Research.
Experts have also predicted an upswing in cases of domestic violence, much of which is committed with firearms. In a few cities, domestic violence, like gun violence, has fallen less than overall crime, an analysis by The Marshall Project found.
In contrast to gun homicides and assaults, one type of gun offense did fall along with other types of violent crime: robberies.
According to Webster, a decrease in armed robberies is likely the result of fewer people around to be robbed. “Victims of gun robbery are often coming home from work, out doing errands, or going to a bar,” he said. “Those activities are greatly curtailed.”
When asked about the divergence between rates of gun violence and other types of crime, spokespeople for the Nashville Police Department and the Metropolitan Police Department of Washington, D.C., attributed gun violence to individual actions. (The remaining cities’ police departments did not respond to requests for comment.)
“This pandemic has not changed the behaviors of our most violent offenders,” said Kristen Metzger, a spokesperson for the D.C. police, in an email. “They continue to resolve disputes by shooting each other, even during the mayor’s stay-at-home order.”
Both statements stressed that police officers remain on duty to respond to incidents of crime.
Additional reporting by J. Brian Charles.
A previous version of this story included firearm robberies in the non-firearm violent crime category. The article has been updated to recalculate that category for each city, and to include a new chart showing firearm robbery as its own category. The Dallas gun violence figures in the introduction changed due to a change in data availability. The story was also updated to include 2017 crime data from Washington, D.C., which was originally omitted.
Methodology
For each city and each year of data, incidents were divided into two groups: those in the 30 days before the date of the lockdown or stay-at-home order, and those from the date of the order through the latest data available as of April 28. To account for leap years, the time periods in previous years were defined based on the day of the year, rather than the date itself.
The incidents in each city’s historical data were averaged by year to establish a year-on-year baseline for comparison. The 2020 incidents were calculated as a percentage change from that baseline.
The data sources and dates used for the analysis are below.
| City | Order type | Order start date | Data end date | Data sources |
|---|---|---|---|---|
| Baltimore | State | March 30 | April 17 | All years |
| Chicago | State | March 21 | April 19 | All years |
| Dallas | County | March 24 | April 22 | All years |
| Los Angeles | State | March 19 | April 19 | Historical, 2020 |
| Nashville | City | March 23 | April 12 | 2015, 2016, 2017, 2018, 2019, 2020 |
| New Orleans | State | March 23 | April 26 | 2015, 2016, 2017, 2018, 2019, 2020 |
| Philadelphia | City | March 23 | April 25 | Crime incidents, shooting victims |
| Tucson | State | March 31 | April 23 | 2016, 2017, 2018, 2019, 2020 |
| Washington, D.C. | City | April 1 | April 26 | 2015, 2016, 2017, 2018, 2019, 2020 |
The exact proscriptions of these orders vary and were not taken into account in the analysis. Throughout this article, the terms “lockdown,” “stay at home,” and “shelter in place” are used interchangeably.
For each city, the non-firearm violent crime category consists of incidents in whichever subset of the following categories were present in the city’s data: homicide, murder and nonnegligent manslaughter, assault (including aggravated and simple assault), battery, robbery, rape, sexual assault, and sexual abuse.
The framework for each city’s analysis differs slightly depending on the crime data made available by that city’s police department.
The historical baseline rates were established using several years of past data. Every city’s baseline was calculated with five years of data beginning in 2015, except for Tucson (four years, beginning in 2016) and Dallas (two years, beginning in 2018).
Philadelphia tracks shootings in a separate database from overall crime incidents, so its “other violent crime” category includes shooting incidents as well. For every other city, “other violent crime” excludes gun violence. The data for Baltimore and New Orleans include shootings as a distinct category; for the remaining cities, incidents of gun violence were identified by the presence of a weapon or method indicator in the data.
Except for Philadelphia, Baltimore, and New Orleans, the non-homicide incidents present in each city’s gun violence data are not shootings but firearm assaults. The FBI’s definition of aggravated assault includes attacks that involve the “display of — or threat to use — a gun, knife, or other weapon.”
Chicago does not provide weapon information for homicides, so its gun violence category includes all homicides, including those that do not involve firearms. (Data collected by The Chicago Sun-Times shows that 88 percent of the homicides in Chicago in 2018 and 2019 involved firearms.)
Baltimore publishes victim-level crime data, with one row of data for each crime victim. Every other city provides incident-level data, collapsing all of a crime’s victims into a single row.
The Metropolitan Nashville Police Department covers the city of Nashville and the surrounding Davidson County.